Bizarre Angular template debugging technique no one really talks about

Since angular templates are actually transformed by the angular compiler to javascript, this transformation gives us access to sourceMaps. This allows us to actually add breakpoints to our angular templates! 🤯
Although using this technique is not perfect at the moment, it is definitely good to know about its existence.
Structural Directive Breakpoints
It’s a cool trick to quickly inspect your angular *ngIf context, property binding or event binding event data! This also works with other structural directives like *ngFor too!
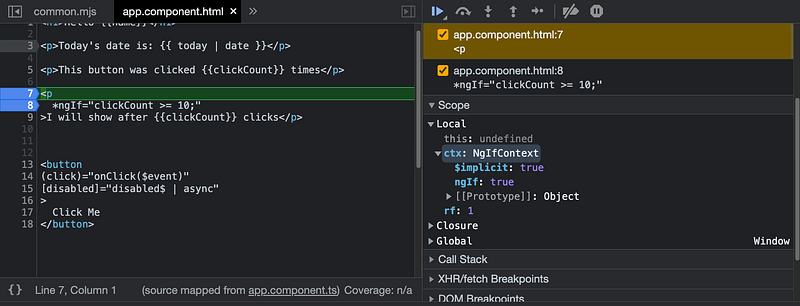
Let’s say you had a template node for a paragraph p with the *ngIf directive which was assigned an expression. Add a breakpoint to this node in your browser’s devtools.
It seems like whenever the expression evaluates to true or false, your breakpoint will get triggered and you can actually inspect the NgIfContext in your Local Scope to see if the resulting expression is true in the ctx.$implicit property.

You can also add the breakpoint to the *ngIf attribute by putting it on it’s own line. This will enable you to inspect your component in the Local Scope every time change detection runs and the expression is evaluated.
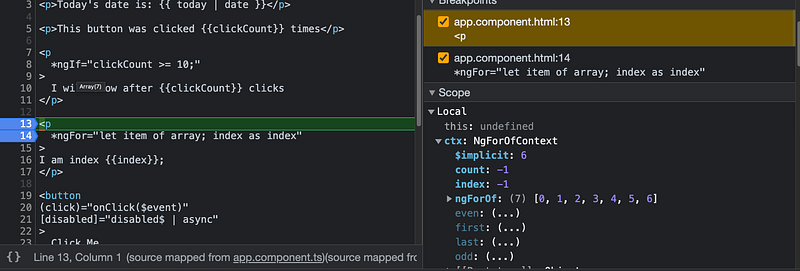
This works with *ngFor as well.

Event Binding Breakpoints
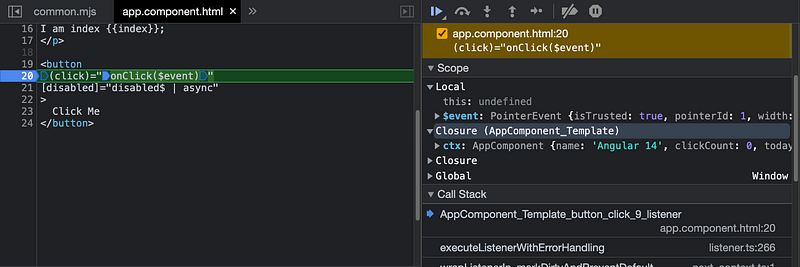
Similarly you can also add breakpoints to your event binding expressions to debug the event context.

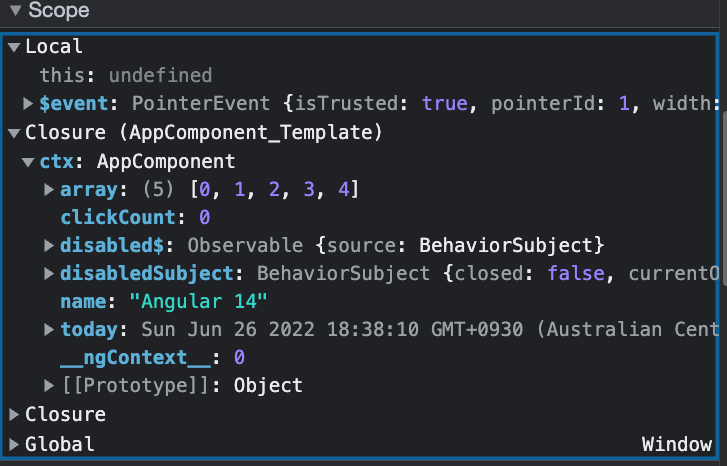
You can inspect the $event in the Local Scope of your debugger as well as find the component instance in the Closure under ctx

Bonus
As a bonus, you can also install Angular DevTools as a chrome extension which give’s you ability to inspect the properties of your component instance in real time among other cool debugging features!

Feel free to reach out and let me know how it works for you ;)
Happy Engineering!
